Stazus is in private beta. Help shape the product and keep lifetime founder benefits.

Apply to be a beta tester
stazus
CoverageWorkflowWhy Stazus
Sign inStart monitoring
Looking for the docs?

Know what broke.
Before customers do.

Monitor websites and HTTP APIs, detect availability and latency problems, and keep incident response in one place.

Start monitoring
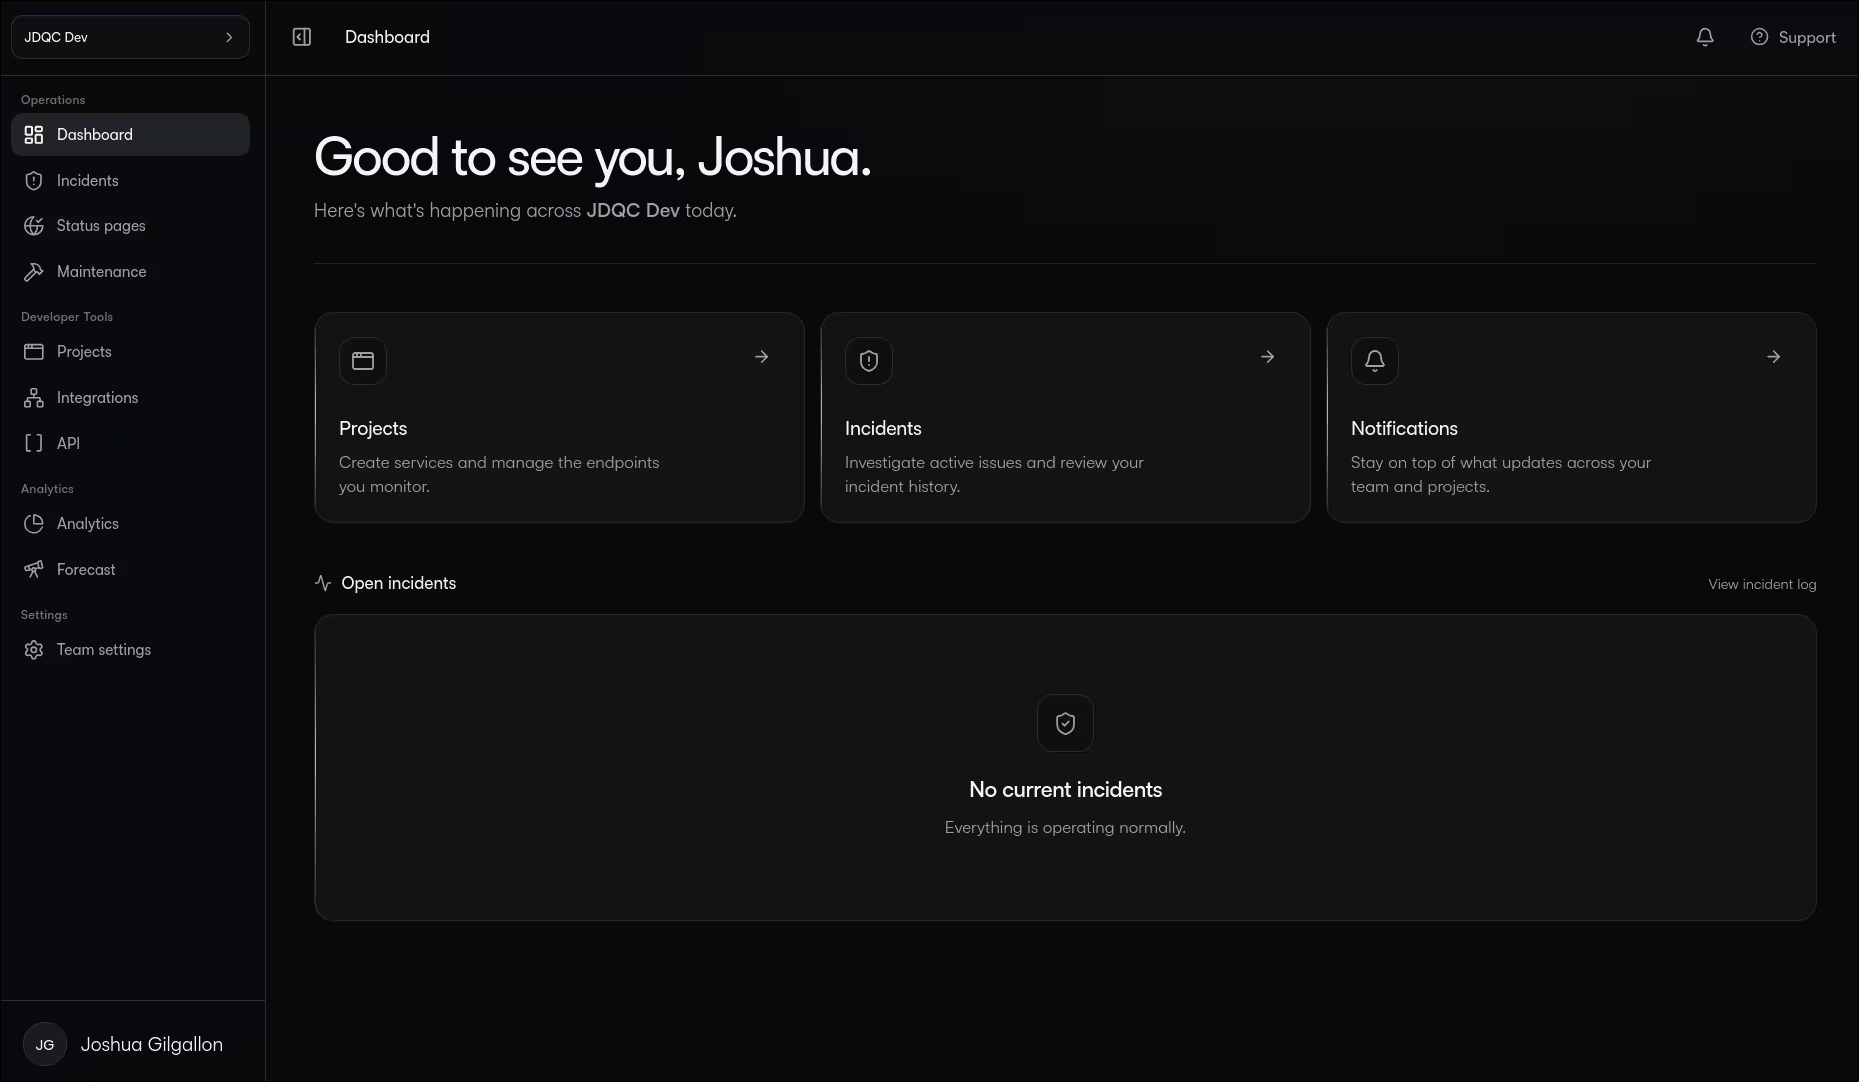
Stazus dashboard showing projects, incidents, notifications, and service health

Monitor the signals your team depends on.

Stazus checks website and API endpoints, records the evidence, and connects failed or slow checks to incident response.

Check websites and HTTP APIs.

Send scheduled GET, HEAD, or OPTIONS requests to verified destinations.

  • Custom headers, query values, and request payloads
  • Expected status and exact, contains, or JSON-subset body matching
  • Recorded latency, status, failure reason, and capped response evidence
app.example.com212 ms
api.example.com48 ms
cdn.example.com31 ms
hooks.example.com96 ms

Keep monitored destinations and secrets controlled.

Stazus blocks private, link-local, metadata, and unsafe network destinations.

  • GET, HEAD, and OPTIONS monitoring methods only
  • Per-team request and bandwidth limits
  • Encrypted sensitive headers, query values, and body configuration

Separate slow responses from availability failures.

Use fixed thresholds or let Stazus learn a latency baseline.

  • Fixed, shadow, and adaptive latency detection modes
  • Uptime, failure, and latency charts with exportable data
  • Maintenance windows that preserve evidence while suppressing incidents

Coordinate incidents around recorded check evidence.

Automatic and manual incidents stay connected to responders, updates, and affected endpoints.

  • Availability and latency incidents with automatic recovery
  • Manual incidents, comments, checkpoints, and incident merging
  • In-app and verified-email notification destinations
  • Team invitations, editor and viewer roles, and per-user subscriptions
  1. Check failed — api.example.com

    14:02:11

  2. Incident opened automatically

    14:02:12

  3. On-call engineers notified

    14:02:14

  4. Response checkpoint added

    14:03:02

Your browser does not support this video.

Operational controls for HTTP monitoring teams.

Configure checks, maintenance, incident response, team access, and automation from the same service.

Team access controls

Invite verified users, assign editor or viewer access, and configure notification subscriptions per person.

Checks from every 30 seconds

Choose a schedule of at least 30 seconds and a request timeout that stays below that interval.

Network safeguards

Stazus blocks private, link-local, metadata, and unsafe network targets before a request leaves the checker.

Maintenance windows

Keep checks running during planned work while Stazus suppresses automatic incidents and excludes affected analytics.

Developer API and MCP

Create scoped API tokens or connect an MCP client to read monitoring data and manage supported resources.

One place to see what is healthy, what needs attention, and who is handling it.

Start with the checks you need now. Keep the rest of your stack in the same place as you grow.

Get startedJoin the beta program
stazus

HTTP monitoring, latency detection, and incident response for operational teams.

PRODUCT

  • Monitoring
  • Incident management
  • Maintenance
  • Status pages (planned)

RESOURCES

  • Documentation
  • API reference
  • Help centre
  • Changelog

COMPANY

  • About
  • Contact
  • Beta program

LEGAL

  • Privacy policy
  • Terms of service
  • Security
  • Cookie policy
© 2026 Stazus. All rights reserved.Service status and support